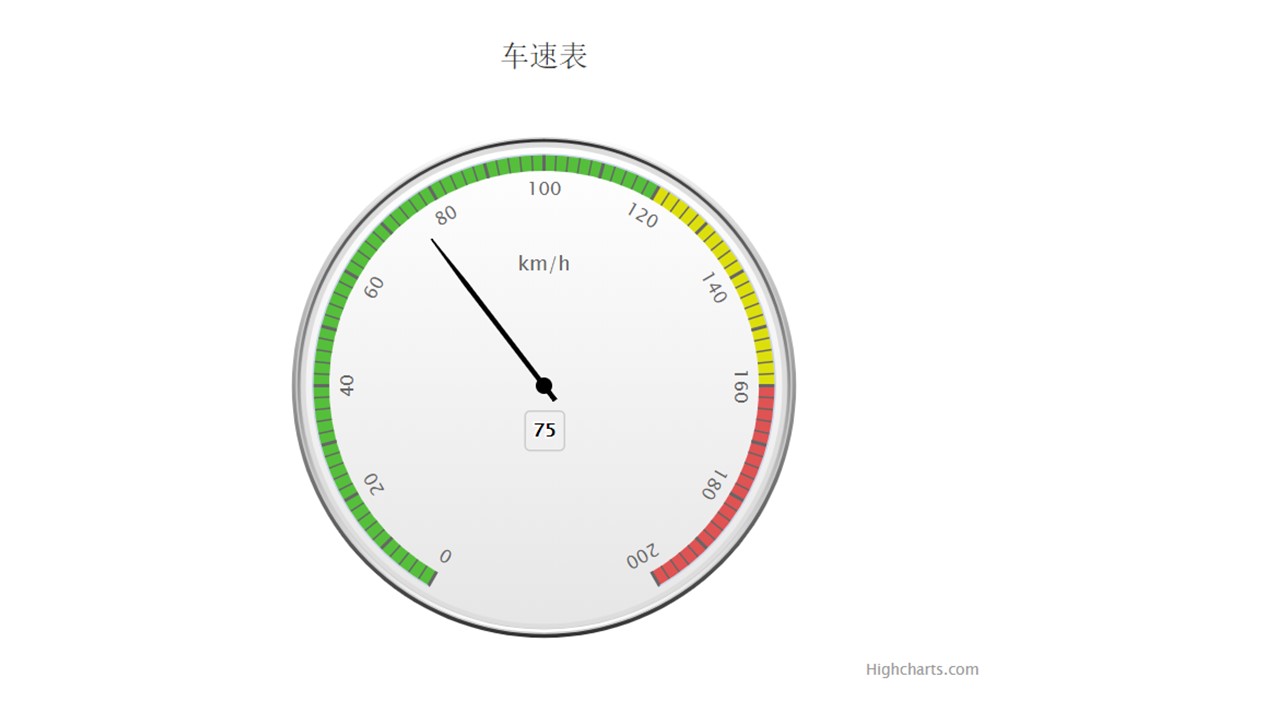
Assalamualaikum Warahmatullahi Wabarakatuh... Selamat Malam mas Roby dan teman-teman semua, Tolong pencerahannya bagaimana membuat grafik GAUGE dengan HighCharts , database MySQL dan menampilkan container ya? Saya lihat contoh yang ada di tutorial highcharts seperti ini: <html> <head> <meta charset="UTF-8" /> <title>Highcharts ?? | ???(w3big.com)</title> <script src="http://apps.bdimg.com/libs/jquery/2.1.4/jquery.min.js"></script> <script src="http://code.highcharts.com/highcharts.js"></script> <script src="http://code.highcharts.com/highcharts-more.js"></script> </head> <body> <div id="container" style="width: 550px; height: 400px; margin: 0 auto"></div> <script language="JavaScript"> $(document).ready(function() { var chart = { type: 'gauge', plotBackgroundColor: null, plotBackgroundImage: null, plotBorderWidth: 0, plotShadow: false }; var title = { text: '???' }; var pane = { startAngle: -150, endAngle: 150, background: [{ backgroundColor: { linearGradient: { x1: 0, y1: 0, x2: 0, y2: 1 }, stops: [ [0, '#FFF'], [1, '#333'] ] }, borderWidth: 0, outerRadius: '109%' }, { backgroundColor: { linearGradient: { x1: 0, y1: 0, x2: 0, y2: 1 }, stops: [ [0, '#333'], [1, '#FFF'] ] }, borderWidth: 1, outerRadius: '107%' }, { // default background }, { backgroundColor: '#DDD', borderWidth: 0, outerRadius: '105%', innerRadius: '103%' }] }; // the value axis var yAxis = { minorTickInterval: 'auto', minorTickWidth: 1, minorTickLength: 10, minorTickPosition: 'inside', minorTickColor: '#666', tickPixelInterval: 30, tickWidth: 2, tickPosition: 'inside', tickLength: 10, tickColor: '#666', labels: { step: 2, rotation: 'auto' }, title: { text: 'km/h' }, plotBands: [{ from: 0, to: 120, color: '#55BF3B' // green }, { from: 120, to: 160, color: '#DDDF0D' // yellow }, { from: 160, to: 200, color: '#DF5353' // red }] }; var series= [{ name: 'Speed', data: [80], tooltip: { valueSuffix: ' km/h' } }]; var json = {}; json.chart = chart; json.title = title; json.pane = pane; json.yAxis = yAxis; json.series = series; // Add some life var chartFunction = function (chart) { if (!chart.renderer.forExport) { setInterval(function () { var point = chart .series [0].points [0], newVal , inc = Math .round((Math .random () - 0.5) * 20); newVal = point.y + inc; if (newVal < 0 || newVal > 200) { newVal = point.y - inc; } point.update(newVal); }, 3000); } }; $('#container').highcharts(json,chartFunction); }); </script> </body> </html> Tampilan seperti gambar terlampir. Bagaimana supaya saya dapat mengisi datanya dengan data yang dari tabel MySQL lalu tampilannya didalam container seperti contoh shart yang selama ini diberikan mas Roby ...? Terima kasih.
Ada 1 File Kiriman : 1. gauge.jpg (49 KB)
|


